I think this is all very interesting. What we don't have is data on p-values, statistical significance, number of responses, etc., so it is hard to judge how scientifically rigorous this data is.
The smaller the p-value, the more significant the result is said to be. For example, if someone argues that "there's only one chance in a thousand this could have happened by coincidence," they are implying a 0.1% level of statistical significance.
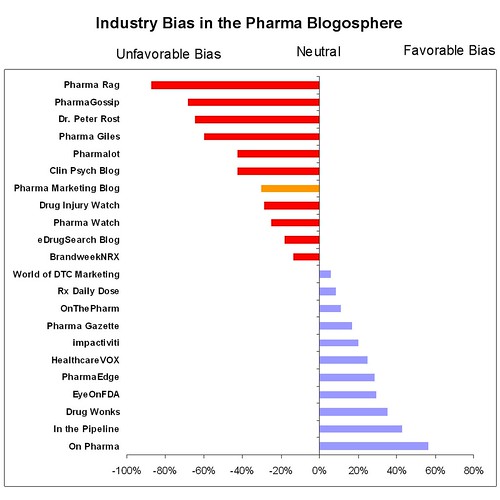
The lower the significance level, the stronger the evidence and if there are too few respondents, like only ten or fifty, then the result may have more to do with coincidence than reality. So while the blogs below that are red may indeed be more negative, the difference between them may not be statistically significant.
That's the theory.
But since none of this data is presented with any of the information needed to actually evaluate the data, it becomes less about science and more about entertainment.
Having said that, you may not be surprised if I think one has to be careful evaluating what you see below . . .
4 comments:
Peter,
The data is based on 144 responses, probably not enough to reach the kind of statistical level you wish. But we are all in the same boat as far as that goes.
BTW, people really love your blog -- as do I -- there will be more data that back that up. So don't go dissing the whole thing before you see all the results!
John
Not to worry John. I can't wait to see the results.
The sample is a sample of convenience--those who stumbled upon the survey from the various blogs who announced it. If we knew exactly how many readers there were of these blogs ("the sampling frame population") then we might be able to make some judgments about how predictive the survey is of this population. For example if there were 150 readers and we have a sample of 144 responses then we probably have a good idea of what people were thinking. If there were 15,000 readers, then using our 144 would make for horrendously broad generalizations, although if we re-sampled from the 14,856 non-responders to the survey, we could improve on our conclusions.
Differences between groups really only apply to the observed response population.
Dr Rost,
What kind of statistical analysis do you want? Since the observations were a convenience and very biased sample noted above, AND they are repeated, that is, I assume, each person rated as many of the blogs as they knew, then I am not sure what knowing On Pharma is rated significantly more pharma friendly than questioning authority. I would have to say, that surveys like this, without knowing the denominator, and if the observations were independent, are just PR for PR.
Post a Comment